
The Story Behind KI-Tax: A Free Canadian🇨🇦 Tax Estimator for Self-Employed People
How I Built KI-Tax: A Free Canadian Tax Estimator for Self-Employed People(It will stay free)

Last week I wrote about KI-Tax, a free tax estimator I built for self-employed Canadians. A few people asked how it was built, what the stack looks like, and what the process was actually like. So here’s the story.
Where it started
It started the same way a lot of side projects start, with a problem I couldn’t find a good solution to. I wanted to understand my own taxes as a self-employed person in Quebec. I tried building an Excel sheet first, which worked until it didn’t. Then I looked at existing free tools and found most of them were built for employees, not for people running their own business. So in December, I put together a very basic first version in Streamlit, just enough to answer my own questions. It was rough. It only covered QC, the QPP calculation wasn’t fully correct, and it didn’t explain much. But it worked well enough to show me the shape of what I actually wanted to build. So I kept going.
The tech stack
Nothing exotic here. The whole thing is built with:
Python: core logic, all tax calculations.
Streamlit: app framework and structure. Streamlit’s native components are fine for quick prototypes but they have real UI limitations when you want something that looks finished. So a meaningful chunk of the visual layer, the metric cards, the breakdown table, the styling, is hand-written HTML and CSS injected directly inside Streamlit. Not the most elegant approach but it gets the job done and gives you control that native Streamlit components simply don’t offer.
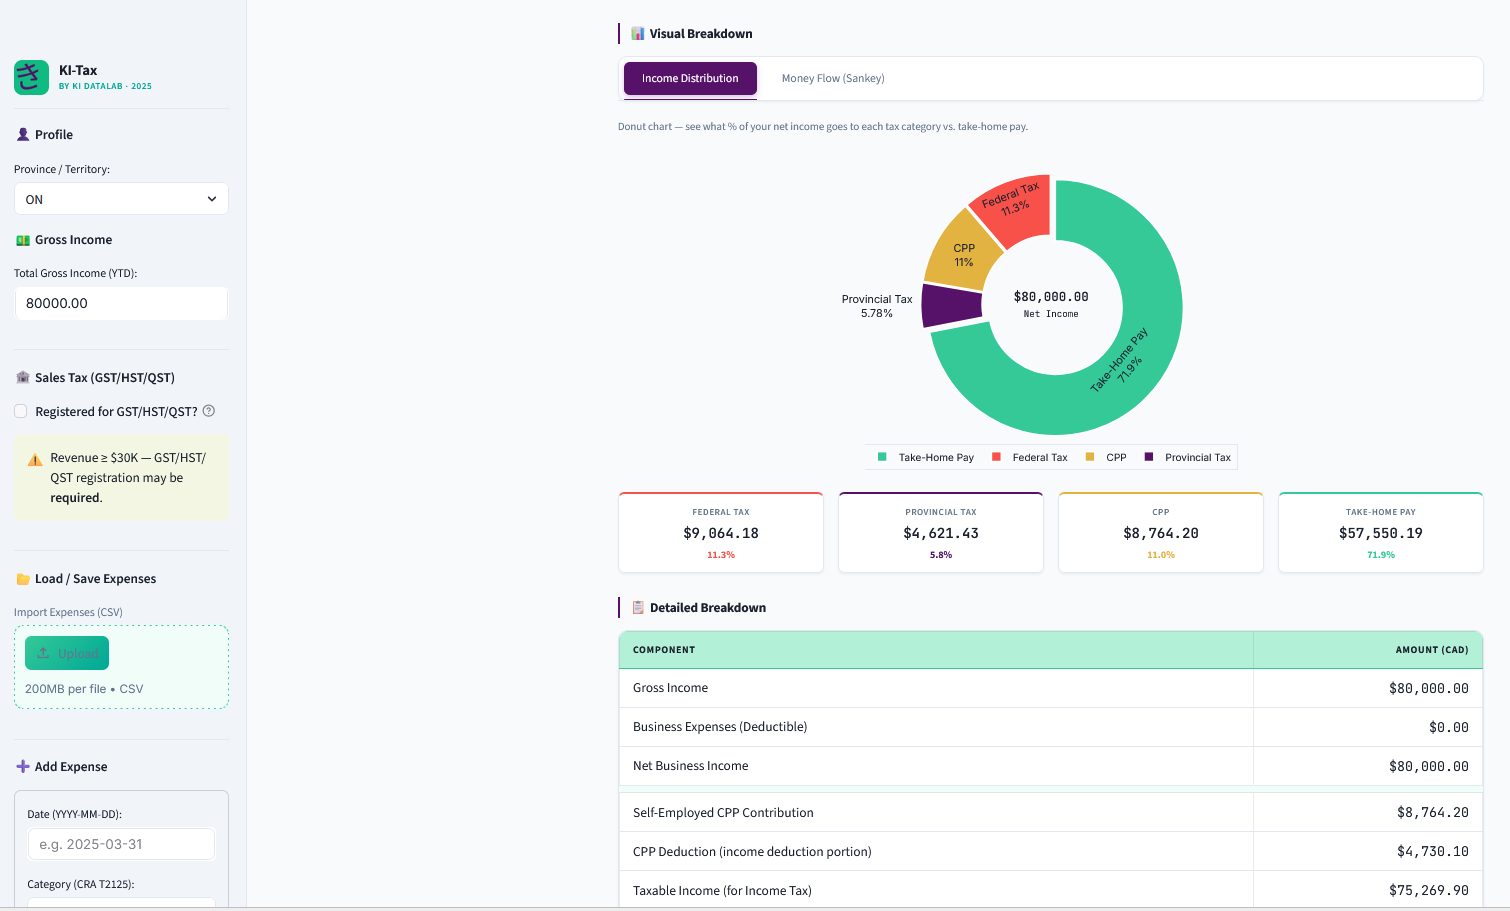
Plotly: the charts. The donut chart for income distribution is straightforward. The Sankey diagram was a deliberate choice, it traces every dollar from gross income through expenses, contributions, and taxes to take-home pay in a way that’s immediately readable even if you’ve never looked at a tax breakdown before. An accountant doesn’t need it but someone trying to understand their taxes for the first time does.
Pandas: expense tracking and data handling.
The tax data lives in a separate Python file as structured dictionaries, federal brackets, all 13 provincial bracket tables, Basic Personal Amounts, CPP and QPP data. No database, no JSON files, just clean Python dictionaries. Simple, readable, and easy to update when rates change every year. Keeping it completely separate from the calculation logic was one of the better early decisions, it means updating 2026 rates next year is a straightforward data change with no risk of touching the calculation logic.
The whole thing is deployed on Railway on the free tier for now. Straightforward setup, no surprises.
The hardest part: verification
Building the UI was the easy part. The hard part, genuinely the most time-consuming and at times frustrating part of this whole project, was making sure the numbers were actually right.
Canadian tax is deceptively complicated. On the surface it looks straightforward: progressive brackets, apply the Basic Personal Amount, done. But the details add up quickly. CPP has two tiers now with different deductibility rules. QPP in Quebec has an additional first tier contribution that most calculators miss entirely. The Quebec federal abatement needs to be applied to pre-credit federal tax, not post-credit. Ontario has a surtax and a Health Premium that are separate calculations. Alberta introduced a new 8% bracket in 2025. Provincial Basic Personal Amounts vary across all 13 jurisdictions and several of them changed for 2025. GST and HST rates differ by province and Nova Scotia quietly reduced its HST from 15% to 14% in April 2025.
Every one of those things had to be found, verified, and cross-checked. My process for this was layered, I used both Claude and Gemini to check the logic and flag potential errors, then verified every number against official sources: the CRA website, Revenu Québec, provincial government pages, and trusted third-party references like TaxTips.ca. This sounds methodical but in practice it meant a lot of back and forth, a lot of “wait, that doesn’t match what the CRA page says,” and more than a few cases where one AI flagged something the other missed, or where both were wrong and the official source was the only thing that settled it. The QPP first additional contribution debate is a good example, there was genuine ambiguity about whether 10.8% or 12.8% was the right self-employed rate depending on how you interpreted “base rate,” and it took going directly to Revenu Québec’s own documentation to confirm the correct answer and understand exactly why.
I used AI assistance throughout the build, for logic checks, catching errors, and as a starting point for research. But I treated every AI output as a first draft that needed verification, not a final answer. For something like tax calculations where being wrong has real consequences for real people, that extra layer of checking against authoritative sources wasn’t optional. It was the whole point.
The final sanity check was running manual calculations for three provinces(Ontario, Quebec, and Alberta) at $80,000 gross income with no expenses, verifying every single component by hand against CRA published figures, and confirming the tool’s output matched to the cent. That’s when I felt confident enough to share it.
What’s next
Honestly? Not much in terms of features, at least not immediately. This tool was built for me and for other self-employed people in Canada who just want to understand their taxes without paying for software or hiring an accountant for a back-of-envelope estimate. It’s free, it’s going to stay free, and there are no plans to monetize it. No premium tier, no subscription, no ads.
What I will do is update it with 2026 rates when they’re confirmed, probably toward the end of the year when CRA and the provinces finalize their numbers. So if you’re bookmarking it for next year, it’ll be there and it’ll be current.
If you also build tools, I’d be curious what you would have built differently. Different stack, different architecture, different trade-offs. There’s no single right way to go from a messy Excel sheet to a deployed tool and I think those decisions are worth talking about.
If you haven’t read my previous post, you can read it here.
If you’re self-employed in Canada and haven’t tried it yet, access the tool here.
If you’d rather read how it works before diving in, there’s a full user guide here.
If you have any questions or any feedback let’s chat in the comments.
Important Disclaimer: This tool provides estimates only based on publicly available 2025 Canadian federal and provincial tax data. It does not account for all tax situations (e.g. RRSP deductions, disability credits, provincial surtaxes, investment income, capital gains, etc.). Always consult a licensed Chartered Professional Accountant (CPA) for accurate, personalized tax advice. Use at your own risk. The CRA and Revenu Québec are the authoritative sources for all tax obligations.